
Do you work with data? If yes, then this blog is for you. In this blog, we’ll introduce you to Power BI – a cloud-based business intelligence and analytics platform that helps you visualize your data and make better business decisions. We’ll also show you some of the different ways in which Power BI can be used to transform your data into actionable insights. So without further ado, let’s get started.
What is Power BI?
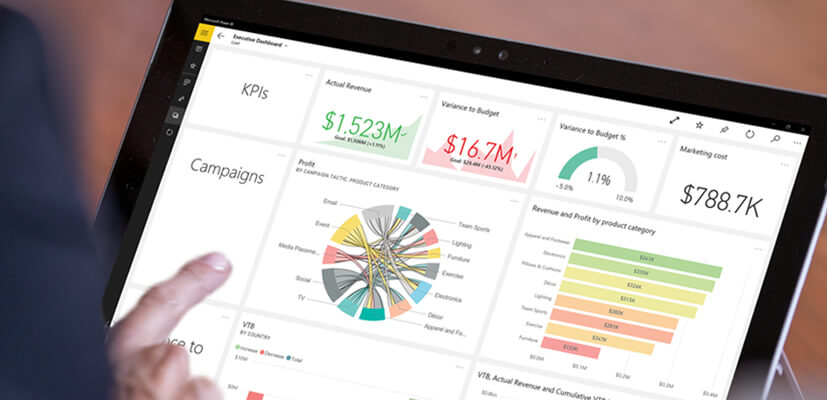
Power BI is a cloud-based business intelligence and analytics platform that enables users to visualize their data and make better business decisions. It was created by Microsoft and first released in 2015. Since then, it has become one of the most popular data visualization tools on the market which can also work with SQL.
Power BI is comprised of three main components:
1. The Power BI service: This is a cloud-based service that allows users to create reports and dashboards based on their data.
2. The Power BI desktop: This is a Windows-based application that can be downloaded and installed on your local machine. It provides a more powerful set of features than the service, such as the ability to connect to multiple data sources and the ability to build complex reports.
3. The Power BI mobile apps: These are apps for iOS, Android, and Windows devices that allow users to access their reports and dashboards on the go.
How Can I Use Power BI?
There are many different ways in which Power BI can be used. Some of the most common use cases include:
1. Connecting to data sources: Power BI can connect to almost any type of data source, including relational databases, flat files, big data sources, social media feeds, and more.
2. Cleaning and transforming data: Once connected to a data source, Power BI can clean and transform your data so that it is ready for analysis. This includes tasks such as removing invalid or duplicate records, formatting dates and numbers, and more.
3. Creating reports: Reports are interactive visualizations that allow you to explore your data in greater detail. They can be created using the drag-and-drop interface in the Power BI service or desktop application.
4. Creating dashboards: Dashboards are collections of reports that allow you to see an overview of your data at a glance. They can be created using the drag-and-drop interface in the Power BI service or desktop application.
5. Sharing insights: Once you have created reports and dashboards, you can share them with other users via the Power BI service or mobile apps. You can also embed them in web pages or applications so that others can view them without needing a Power BI account.
6. Collaborating with others: The Power BI service includes features that allow users to collaborate on reports and dashboards, such as commenting and liking functions, version history, differential privacy settings, and more.
7. Connecting to external tools: The Power BI ecosystem includes hundreds of external tools that extend its capabilities even further. Examples include content packs for popular software applications like Salesforce, GitHub, Zendesk, Adobe Analytics, etc., custom visuals (i), connectors for popular databases (ii), and much more (iii).
Conclusion:
As you can see from this blog post, there are many different uses for Power Bi depending on your needs as well as how familiar you are with the software There’s no need to feel overwhelmed though! By starting small and gradually adding more complexity over time as needed, anyone can learn how easy it is use this powerful tool transform their raw data into actionable insights!